Web Smarts - Business Savvy
We’ve been building websites since 1998
We are trusted advisors to Over 50 Active Clients within several industries including associations and nonprofits, healthcare, financial services, retail, B2B and more.

We Are
Trusted
Partners
After we deliver a quality website on time and within your budget, we will be there for when it really counts. We will be proactive, consultative and strategic after we launch your website.

We Are
Integration
Experts
We’ve integrated with virtually every AMS system on the market as well as most LMS, publication, advocacy and career center applications. Our company was founded on custom development.

We build websites that are easy to edit, manage and design using the best content management system on the market, Sitefinity CMS.
We Provide A Full Spectrum Of Services


Our Clients Are Our Partners....
John Wurm

The team at Vanguard helped us think about our digital presence from the perspective and needs of our users, while holding true to the values our organization espouses.
Connect With Us
Improve Your Webcopy
Sitefinity 13


The
Vanguard View
Technology articles about one topic from the perspective of Leadership, Marketing and IT professionals .
What’s a Website Heatmap?
Heatmaps are a visual representation of collected website data, and for that reason, are critical when configuring website conversion goals. Developed in the 1990s by Cormac Kinney, they allow us to track user interaction within a website and provide an in-depth look as to what users do on your website based on mouse-cursor clicks.
Have you’ve ever asked yourself – what elements on your website are users interact with? Or, are users interacting with a specific call-to-action on your homepage? Well, that’s exactly the information that is available to you within a heatmap.
Generally speaking, heatmaps are configured using third-party based applications and rely on a tracking script. When the tracking script is installed on a website, it sends data to an application, that then collects user-clicks, and displays the information in an application.
The Different Types of Heatmap Reports
Click Heatmap- This is a visual overview of where on your website visitors are clicking. The brighter the area, the more active and important it is to your users. The darker the area, the least active and critical it is to your users.

Scroll map - This is yet another visual representation of the sections within your website that are viewed the most. A scroll map analyzes how your visitors scroll through your website. They can inform you what sections of a web page, visitors ultimately stop engaging with for example. Brighter areas represent sections that are more popular as opposed to darker areas, which are least popular.
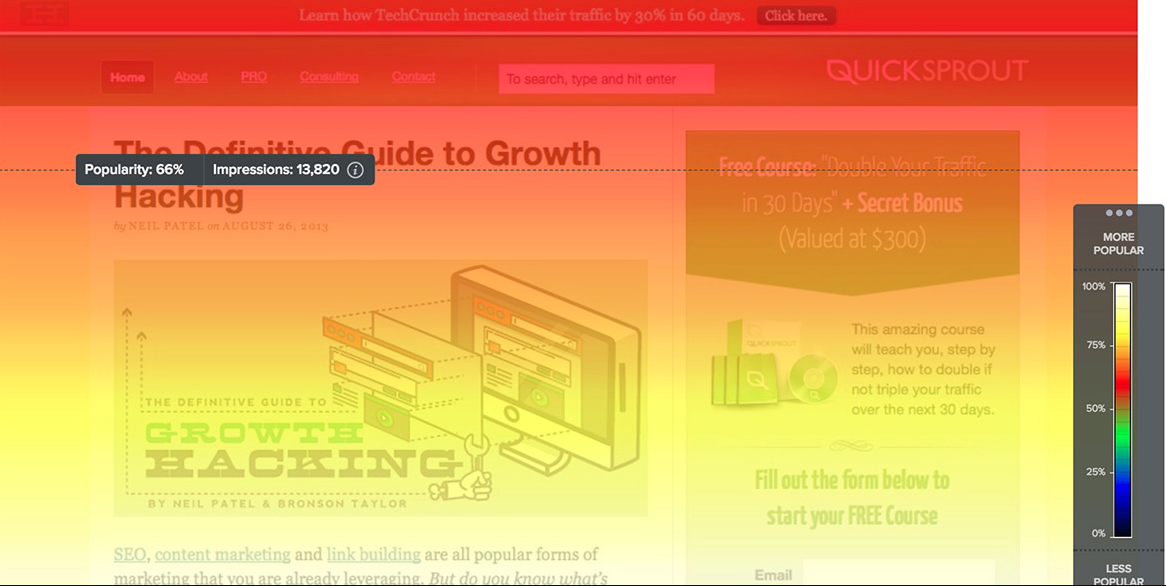
Overlay - This report categorizes the elements (login button, search box, navigation bar, etc.) within your website and indicates how many times each element has been interacted with. Markers that are colored in red should be considered the most popular elements on your website.
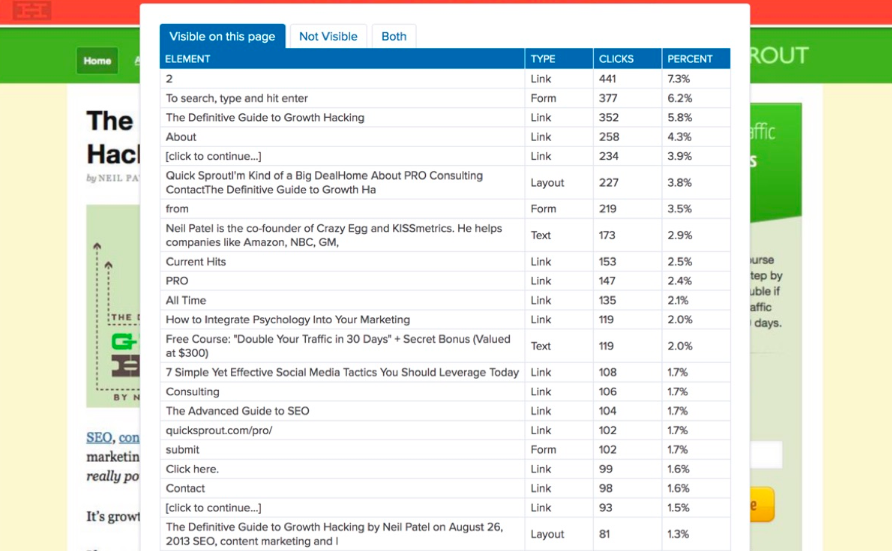
List - A list report provides a breakdown of all elements that reside on your website, through a tabular list or spreadsheet view. They typically include the number of clicks and percentages per each element that is interacted with.
Eye-Tracking – Eye-tracking software regarding web-based applications is used to identify where a user is looking. By utilizing eye-tracking applications, one can create a visual attention system that can assign a particular attention score to elements on a web page. These sophisticated applications can provide detailed data on what users view as soon as they land on a web page, and what information grabs their attention before they’ve clicked on elements with their mouse cursor.
Why Use a Heatmap on your Website
You may be telling yourself, well I can simply gather this information using Google Analytics, right? Not really.
Google Analytics does a terrific job of providing key metrics, such as top-landing pages, bounce rates, and how many times a user viewed your homepage to name a few. However, a heatmap can provide you with a thorough representation of user behavior. They allow you to gather information on what your end-users ultimately want to see on your website and can help you reorganize, and tailor your website to the content and most critical information that individuals seek on your website.
The Benefits of Using Heatmaps
One valuable factor that heatmaps provide is to eliminate assumptions. E.g., You might think that individuals are selecting the “Register for our Annual Conference” button, near your login button on the top-right hand corner of your website. However, a heatmap will quickly solidify whether or not this is the case.
You might find that users are not scrolling that far down your website’s homepage, and a factor that should be considered in that scenario is trimming down some of that content. Ultimately heatmaps can assist you with delivering a website that caters to the information that is important to your users and help you achieve your marketing and conversion goals.
To learn more about Vanguard’s heatmap tracking process, and when you are scheduled to receive your 2020 homepage heatmap report, please contact your Client Service Manager at Vanguard Technology.
Vanguard Tips & Tricks
We provide helpful hints you never knew you needed for our clients. Check out "Vanguard Tips & Tricks" to learn quick and simple hacks to make managing your website easier than ever.
What’s a Website Heatmap?
Heatmaps are a visual representation of collected website data, and for that reason, are critical when configuring website conversion goals. Developed in the 1990s by Cormac Kinney, they allow us to track user interaction within a website and provide an in-depth look as to what users do on your website based on mouse-cursor clicks.
Have you’ve ever asked yourself – what elements on your website are users interact with? Or, are users interacting with a specific call-to-action on your homepage? Well, that’s exactly the information that is available to you within a heatmap.
Generally speaking, heatmaps are configured using third-party based applications and rely on a tracking script. When the tracking script is installed on a website, it sends data to an application, that then collects user-clicks, and displays the information in an application.
The Different Types of Heatmap Reports
Click Heatmap- This is a visual overview of where on your website visitors are clicking. The brighter the area, the more active and important it is to your users. The darker the area, the least active and critical it is to your users.
Scroll map - This is yet another visual representation of the sections within your website that are viewed the most. A scroll map analyzes how your visitors scroll through your website. They can inform you what sections of a web page, visitors ultimately stop engaging with for example. Brighter areas represent sections that are more popular as opposed to darker areas, which are least popular.
Overlay - This report categorizes the elements (login button, search box, navigation bar, etc.) within your website and indicates how many times each element has been interacted with. Markers that are colored in red should be considered the most popular elements on your website.
List - A list report provides a breakdown of all elements that reside on your website, through a tabular list or spreadsheet view. They typically include the number of clicks and percentages per each element that is interacted with.
Eye-Tracking – Eye-tracking software regarding web-based applications is used to identify where a user is looking. By utilizing eye-tracking applications, one can create a visual attention system that can assign a particular attention score to elements on a web page. These sophisticated applications can provide detailed data on what users view as soon as they land on a web page, and what information grabs their attention before they’ve clicked on elements with their mouse cursor.
Why Use a Heatmap on your Website
You may be telling yourself, well I can simply gather this information using Google Analytics, right? Not really.
Google Analytics does a terrific job of providing key metrics, such as top-landing pages, bounce rates, and how many times a user viewed your homepage to name a few. However, a heatmap can provide you with a thorough representation of user behavior. They allow you to gather information on what your end-users ultimately want to see on your website and can help you reorganize, and tailor your website to the content and most critical information that individuals seek on your website.
The Benefits of Using Heatmaps
One valuable factor that heatmaps provide is to eliminate assumptions. E.g., You might think that individuals are selecting the “Register for our Annual Conference” button, near your login button on the top-right hand corner of your website. However, a heatmap will quickly solidify whether or not this is the case.
You might find that users are not scrolling that far down your website’s homepage, and a factor that should be considered in that scenario is trimming down some of that content. Ultimately heatmaps can assist you with delivering a website that caters to the information that is important to your users and help you achieve your marketing and conversion goals.
To learn more about Vanguard’s heatmap tracking process, and when you are scheduled to receive your 2020 homepage heatmap report, please contact your Client Service Manager at Vanguard Technology.
Case Studies
Vanguard conducts thorough preliminary investigative work to ensure your website is built to cater specifically to your target audience and meet your organization’s goals. Check out some of the case studies on some of our most recent client success stories.


What Can Vanguard Do For You?
As your organization grows and evolves, your website should as well. Whether you are looking to generate more traffic, implement custom functionality, mobile compatibility, integrate your systems, or give your site a complete redesign, Vanguard Technology is your go-to web partner. Reach out to us with your current concerns with your website, and our experts will happily provide a solution.
Leave a commentOrder by
Newest on top Oldest on top